Lecture and workshop from Catherine D’Ignazio

What happens when coding, creativity, and commitment to social justice come together? One answer is Catherine D’Ignazio. A researcher, designer, and software developer, D’Ignazio is Assistant Professor of Civic Media and Data Visualization in the Journalism Department at Emerson College. She is also a Principal Investigator at the Emerson Engagement Lab, a Research Affiliate at the MIT Center for Civic Media, and a co-director of The Institute for Infinitely Small Things.
On February 16, D’Ignazio will give a public lecture, “Playful Data, Empowered Publics.” The next morning, February 17, she will lead a workshop, “Creative Data Storytelling 101.” She is a guest of Digital Bridges for Humanistic Inquiry: A Grinnell College/University of Iowa collaboration funded by the Andrew W. Mellon Foundation.
Bridging Public Art, Coding, and Academe
D’Ignazio conducts research in data literacy, media innovation, and civic art as she asks us to consider the social, cultural, and political work of visualizations. Her work considers how data visualizations assert viewpoints, create power relations, produce knowledge, and assert or efface intention even as visualizations can also make data transparent, accessible, and inclusive. The range of her work inspires her to experiment with diverse forms, including public art, design, coding, courses, workshops, and academic writing. Across her many projects, her goal is to make data and data-driven storytelling accessible, inclusive, and empowering.
Data-Driven Storytelling

A commitment to social justice and publicly engaged scholarship has trained D’Ignazio and her students’ attention on dataviz projects focused on feminist and environmental issues. D’Ignazio has co-developed a suite of tools for data literacy (DataBasic.io), developed custom software to geolocate news articles, and developed an application, Terra Incognita, to promote global news discovery. The titles of her visualization projects suggest the breadth of her interests. Terra Incognita “is a serendipitous global news recommendation system designed to help people out of their personalized media filter bubbles.” A series of workshops, Teaching Data Storytelling for Civic Impact, was designed to “build data literacy capacity for non-technical folks, teach ethics in relation to data, and assess the civic impact of data-driven storytelling.”
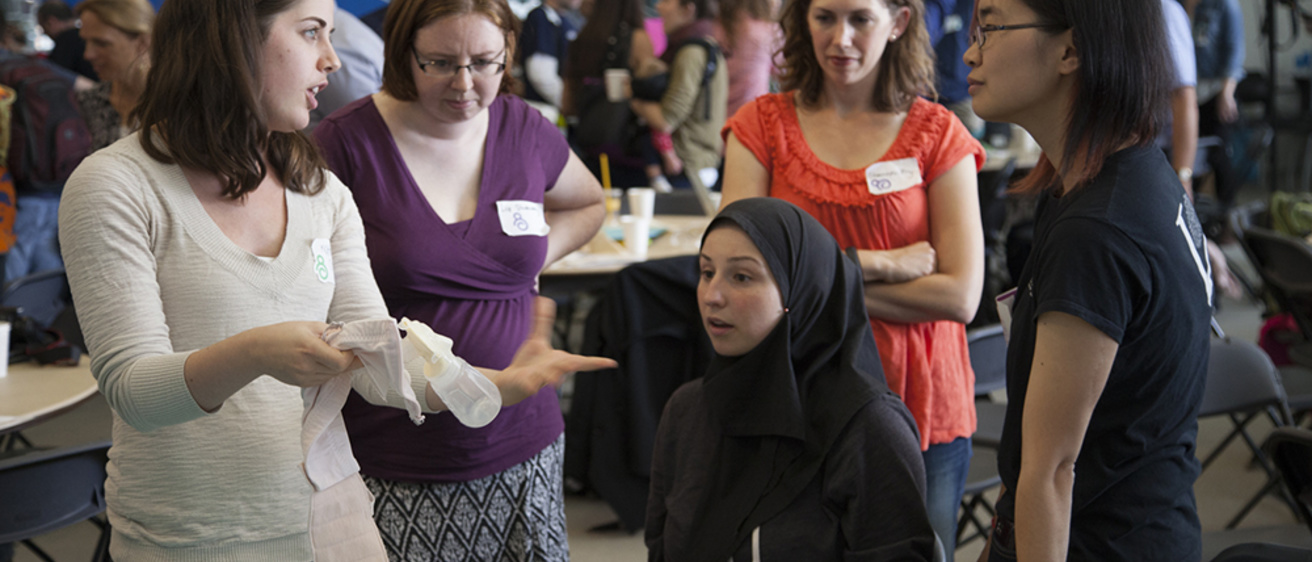
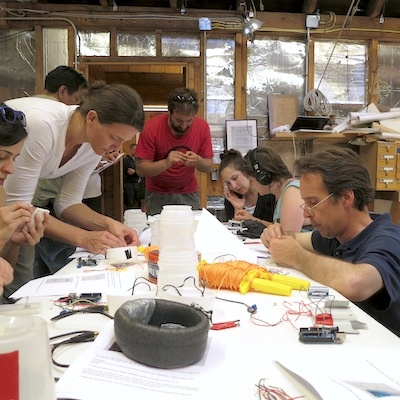
In another fascinating group of projects, D’Ignazio explores embodied visualization. At MIT, she organized a Make the Breast Pump Not Suck Hackathon that brought together 150 parents, engineers, designers, babies, and healthcare providers to tackle “the profoundly terrible experience of breast pumping.” (The hackathon is pictured at the top of this page.) The event led to a film documentary; coverage in over 80 media venues, including The New Yorker, Forbes, CNN, NPR, and the BBC; and eight inventions. Boston Coastline: Future Past, a project she and performance artist Andi Sutton created in collaboration with the deCordova Museum, exemplifies another of D’Ignazio’s creative methods—“walking data visualization.” Scientists, harbor officials, and thirty other participants walked and marked the future water line of Boston as oceans rise, engaging passersby in discussions about climate change data and the future of the city.
Developer of Data Visualization Suite
D’Ignazio and her colleagues have also developed a suite of easy-to-use tools for creating data visualizations and teaching data literacy (DataBasic.io). She is currently working with the Public Laboratory for Technology and Science to create journalistic storytelling with DIY environmental sensors. Her art and design projects have won awards from the Tanne Foundation, Turbulence.org, and the LEF Foundation and have been exhibited at the Eyebeam Center for Art & Technology, Museo d’Antiochia of Medellin, and the Venice Biennial.
For a look at her fascinating data visualization projects and collaborations, as well as links to her digital and print publications, visit her website at http://www.kanarinka.com/.
If You Plan to Go:
Public Lecture: Playful Data, Empowered Publics
Thursday, February 16, 3:30–5:00 p.m.
Minnesota Room (347), Iowa Memorial Union
Communities are swimming in data—demographic data, participation data, government data, social media data—but very few understand what to do with it. Though governments and foundations are creating open data portals and corporations are creating APIs, these rarely focus on use, usability, building community, or creating impact. So although there is an explosion of data, there is a significant lag in data literacy at the scale of communities and individuals. This creates a situation of data haves and have-nots. But there are emerging technocultural practices that combine participation, creativity, and context to connect data to everyday life. These include citizen science, data journalism, novel public engagement in government processes, and participatory data art. This talk surveys these practices both lovingly and critically, including their premises, aspirations, and the challenges to creating citizens that are truly empowered with data.
Data Workshop: Creative Data Storytelling 101
Friday, February 17, 9:00 a.m.–1:00 p.m.
TILE Classroom, Van Allen Hall (#474)
Looking for creative ways to present data, empower communities, and make a strong case? Data storytelling connects numbers and analysis to people in evocative, meaningful ways. In this four-hour workshop, participants will learn the basics of data analysis and visualization using a range of methods and engaging in creative, hands-on activities. These include:
- Creative examples: What do artists and humanists do with data?
- Data visualization: How to critique an infographic.
- Data sourcing: The winding path to the numbers you need.
- Quantitative text analysis: Finding stories by counting words.
- Spreadsheet analysis: Columns are the beginning of questions.
- Network analysis: Connections are data, too.
In the process, participants will learn to use four online data storytelling tools and engage in critical data literacy activities that they can adapt and use in their own classrooms or workplaces to teach others about data storytelling. No prior experience is necessary, and people from creative, non-quantitative backgrounds are welcome. The workshop is free, but registration is required and will be forthcoming at http://iowadigitalbridges.com/event/catherine-dignazios-workshop-creative-data-storytelling-101/. All you need to bring is a laptop and details about a project you’re currently developing.
To learn more about the Andrew W. Mellon–funded Digital Bridges for Humanistic Inquiry: A Grinnell College/University of Iowa Partnership and the upcoming funding opportunities and summer institute in digital storytelling, visit our website at http://iowadigitalbridges.com/.